
Mode Shapes and Eigen Frequencies of a Cantilever Beam
Validating a new modal-analysis workflow on a simple cantilever beam — an acrylic ruler with a cellphone accelerometer — by comparing the first three mode shapes and eigen frequencies across experiment, FEA, and hand calculation.
I wanted to build more confidence in using a new FEA software package for modal analysis. To do this, I set up a simple cantilever beam problem and compared the first three modes from FEA against theoretical calculations and experimental measurements.
Experiment
I first focused on the experiment, using resources that were immediately available. I used a plastic acrylic ruler as the cantilever beam and a cell phone as an accelerometer. A C-clamp was used to fix one end of the plastic ruler to the table.
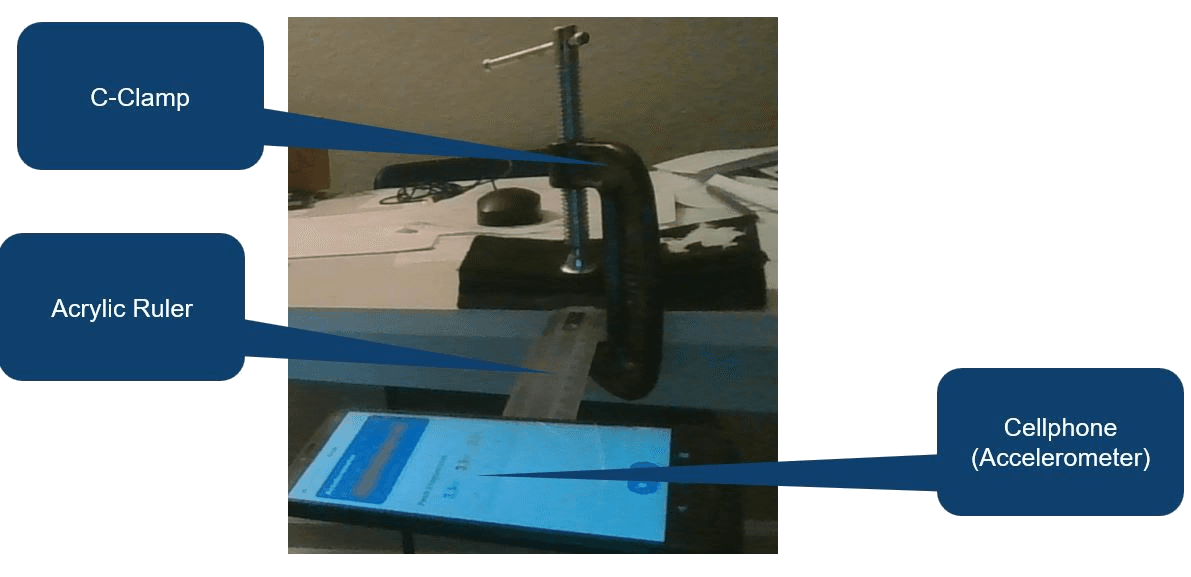
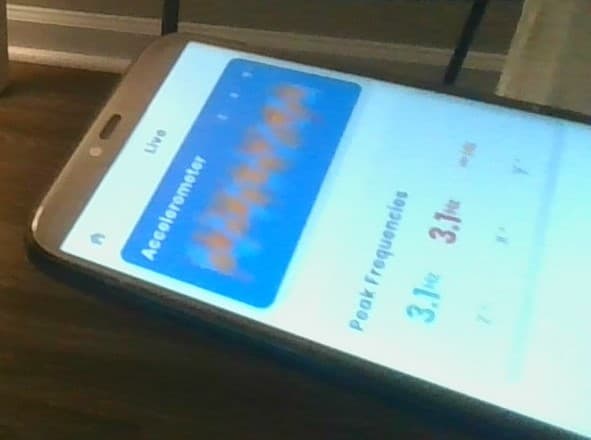
The cell phone was mounted on the ruler using removable adhesive, Plasti-tak. A free accelerometer app called Resonance was used to measure the natural frequency of the system. The measured first mode of the cantilevered ruler and cellphone system was 3.1 Hz.
FEA model
After obtaining the experimental result, I simulated the same problem in FEA and performed a modal analysis. The ruler was modeled using acrylic material properties. The cellphone weighed 200 grams, so a dummy mass of 200 grams was attached to the ruler in the FEA model.
For a simple problem like this, beam elements with a point mass at the end may appear sufficient and would create a quicker, more computationally efficient model. However, the cellphone is not really a point mass. It has a distributed moment of inertia laterally in the X direction, which can result in a low-frequency torsional vibration mode of the ruler. For that reason, I used a 3D FEA model.
Tetrahedral meshing was created using 10-node tetrahedral solid elements. Mesh mating was done, and a glued contact was created between the cellphone and plastic ruler interface. A fixed constraint was applied at the other end of the plastic ruler.
The following figures show the first three mode shapes and eigen frequencies reported by FEA.
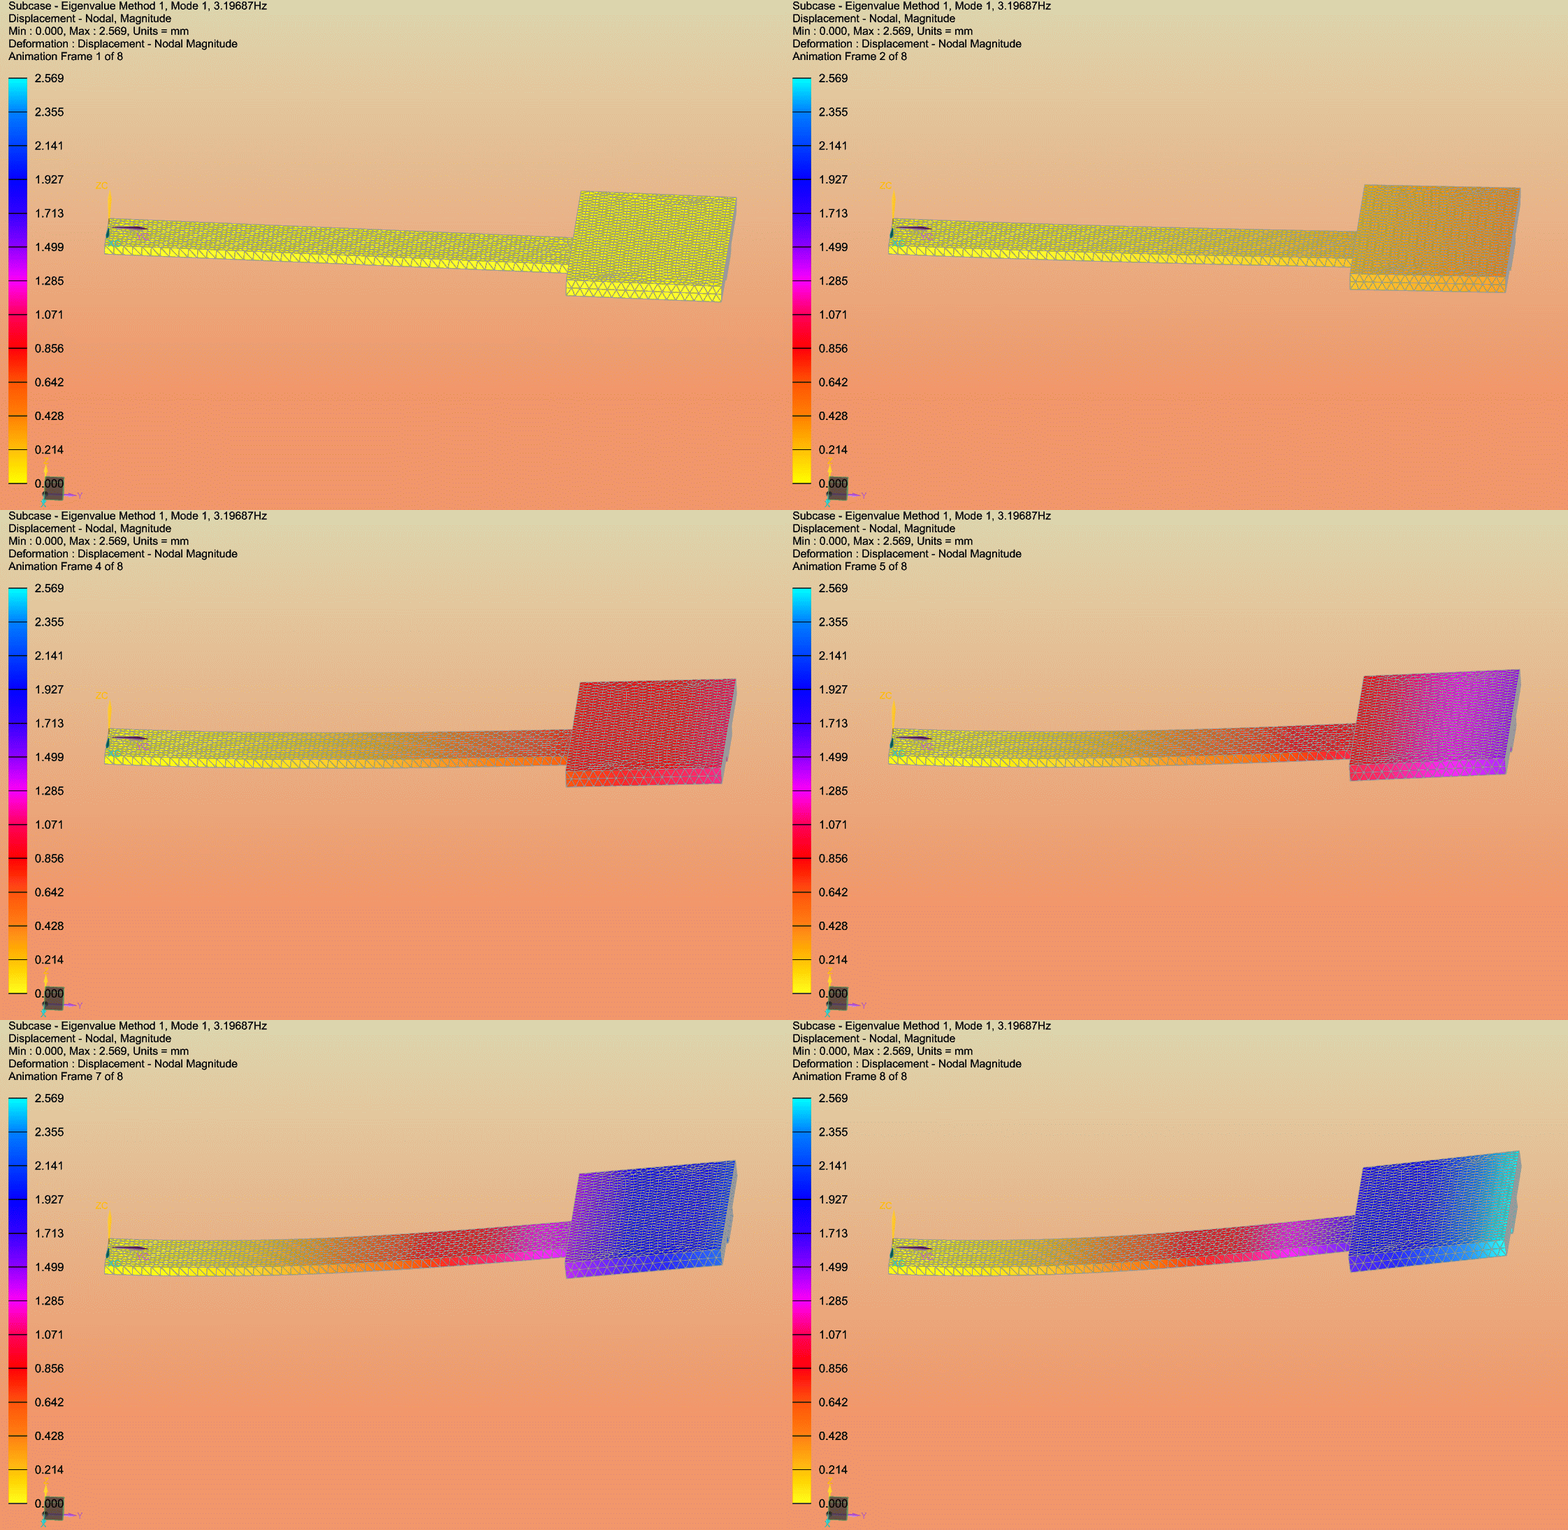
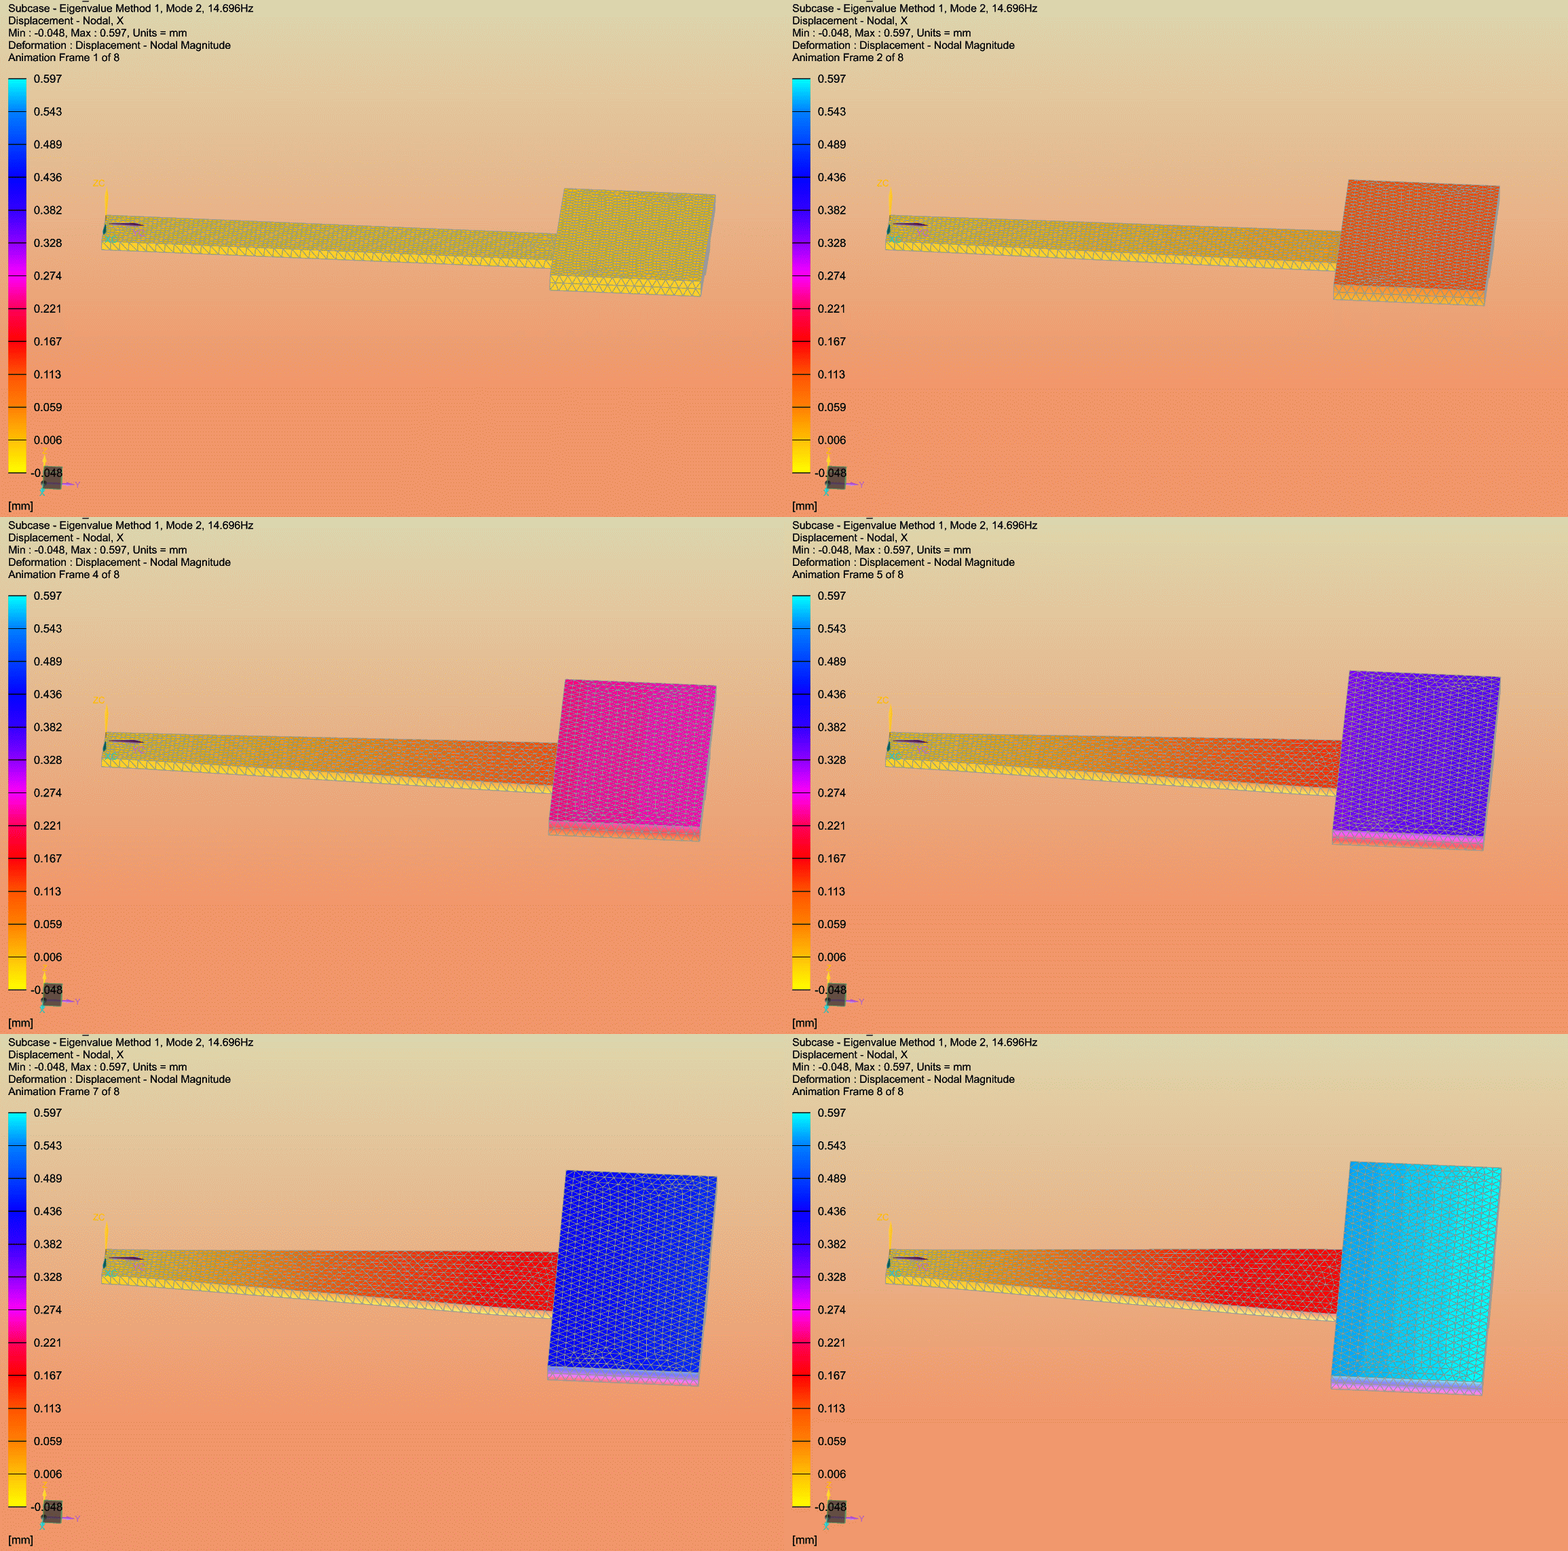
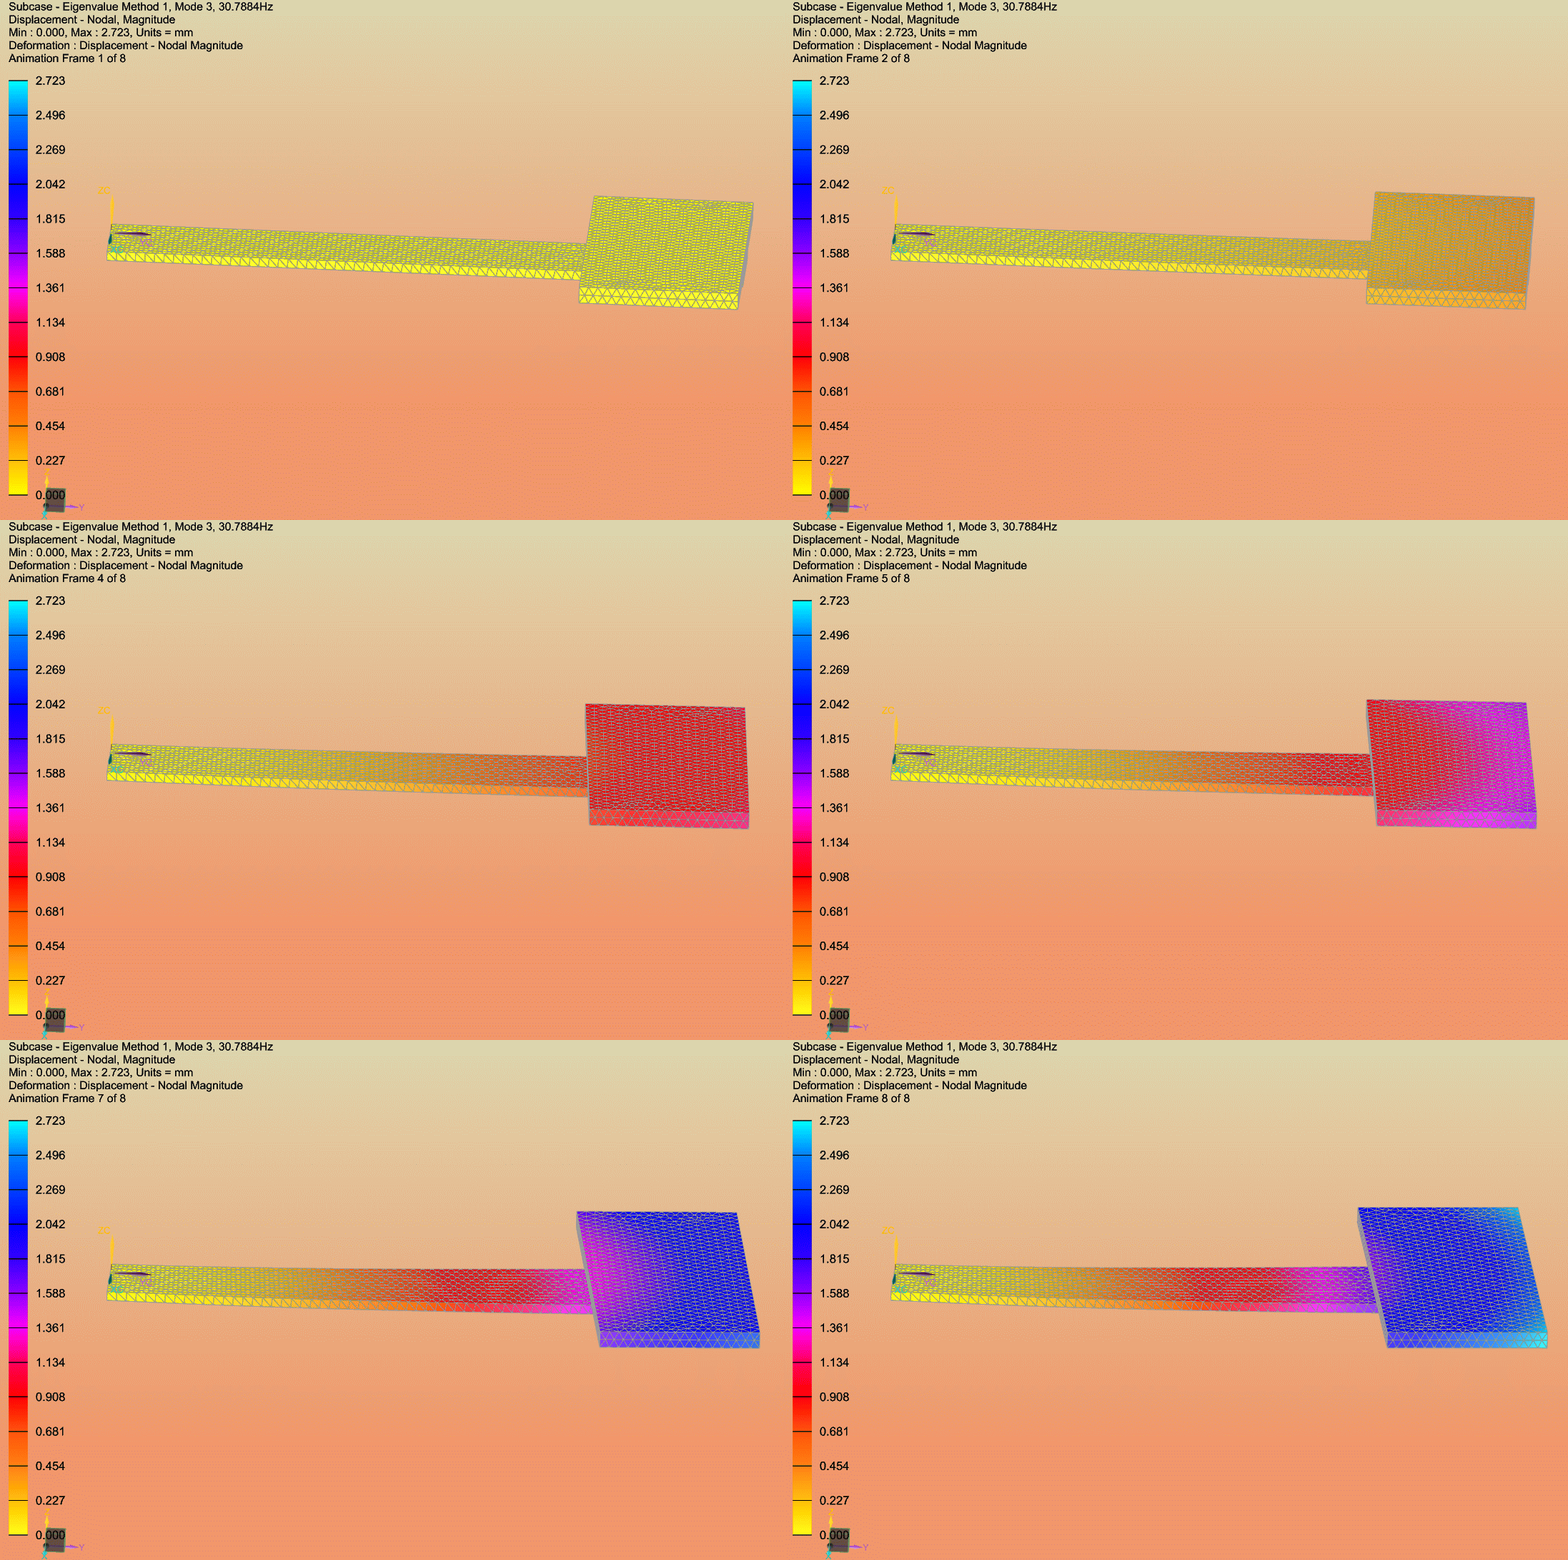
From the animations, the first mode is governed by the bending stiffness of the cantilever beam in the Y-Z plane. The second mode is governed by the torsional stiffness of the ruler about the Y axis. The third mode is governed by the bending stiffness of the ruler in the X-Y plane.
Hand calculations
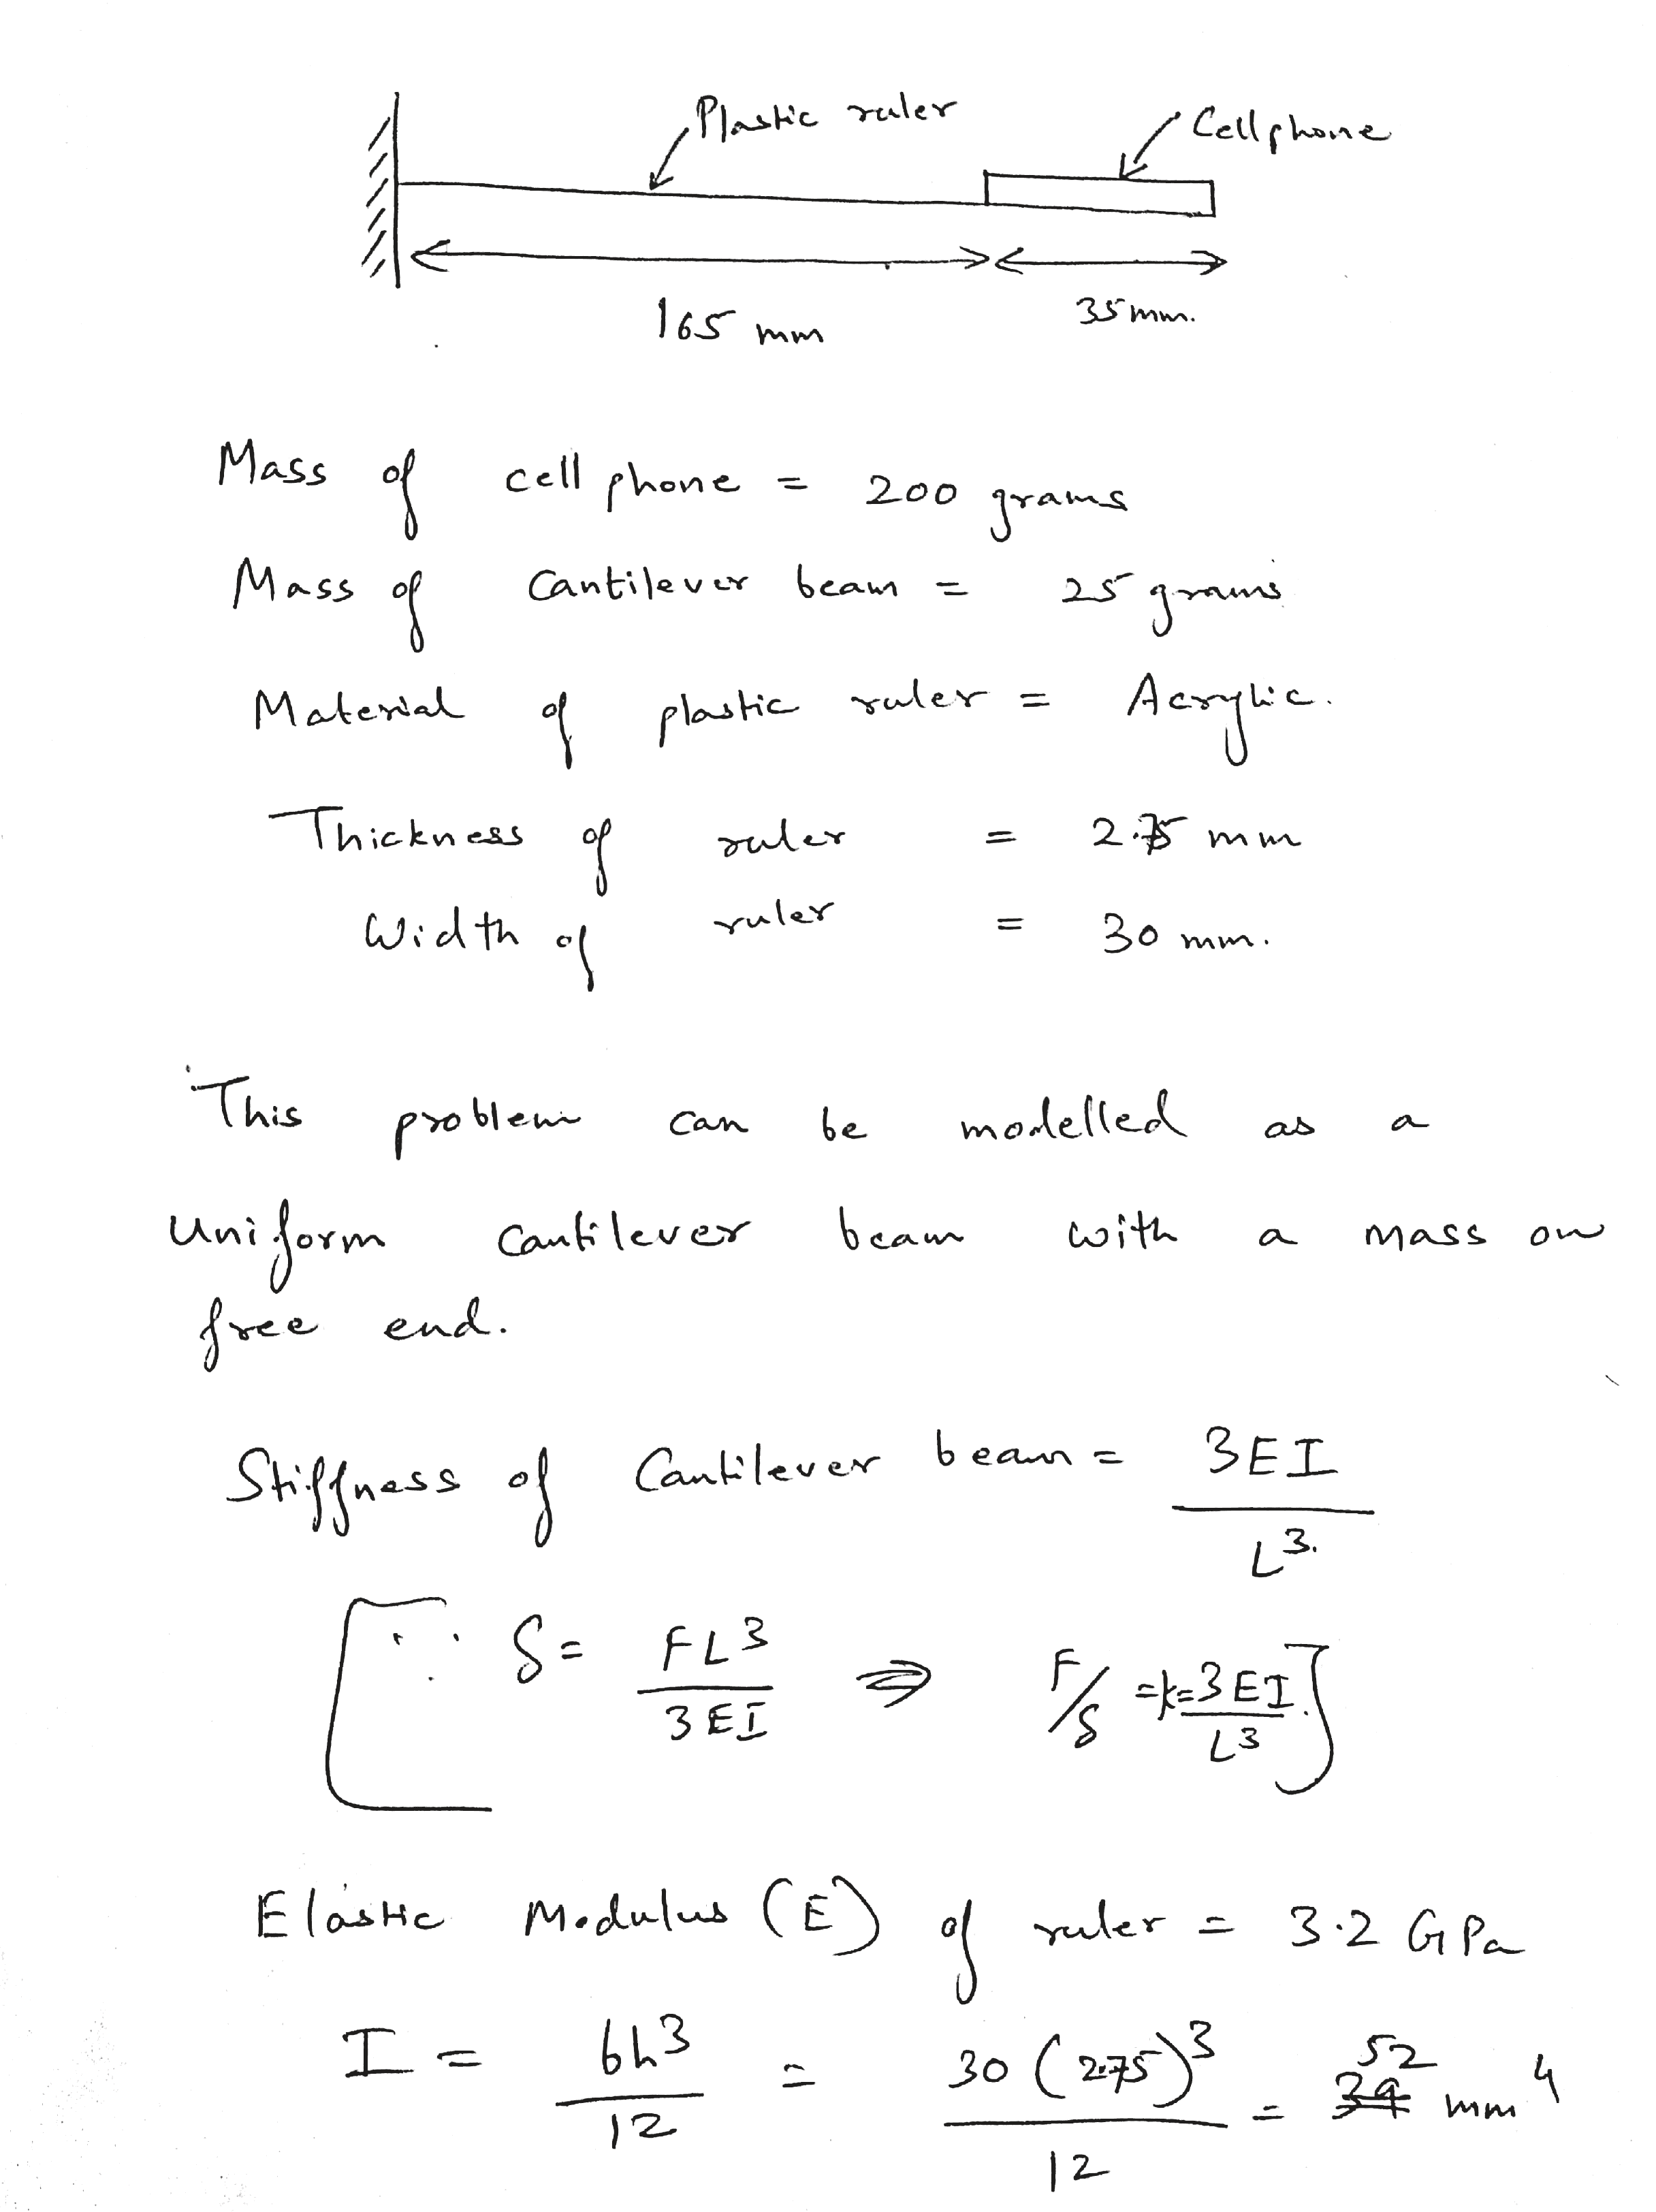
First mode: bending in the Y-Z plane
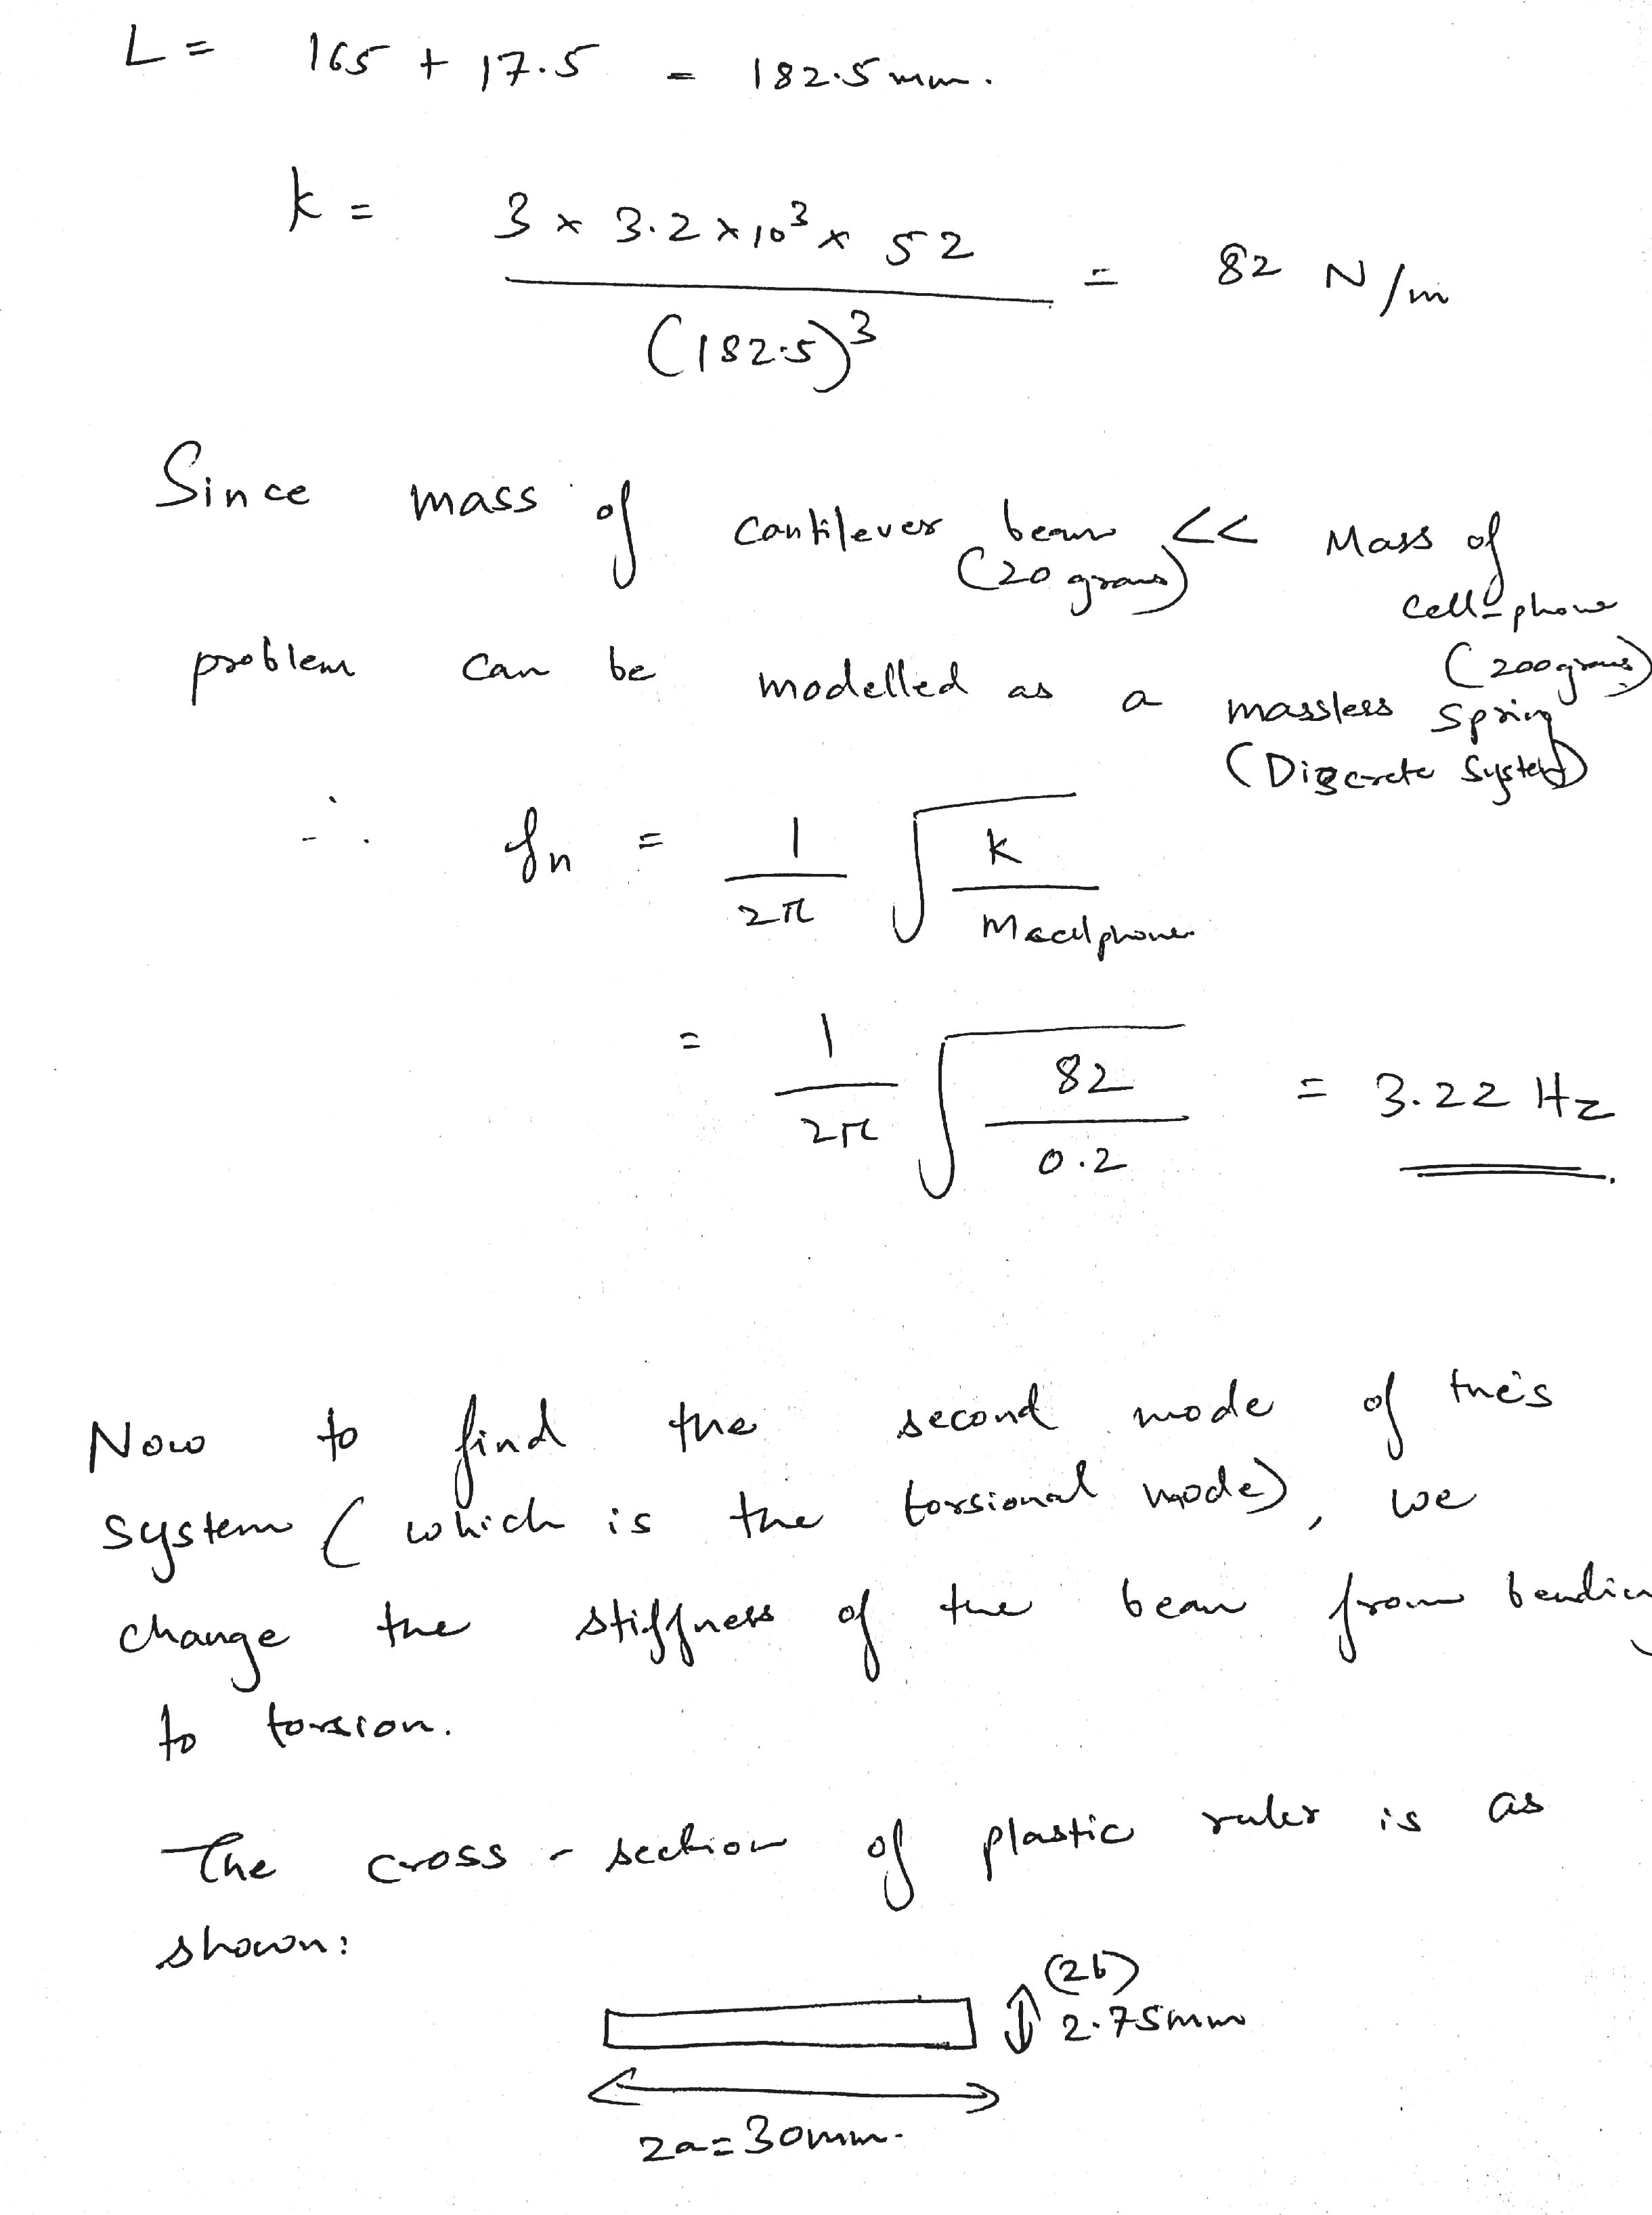
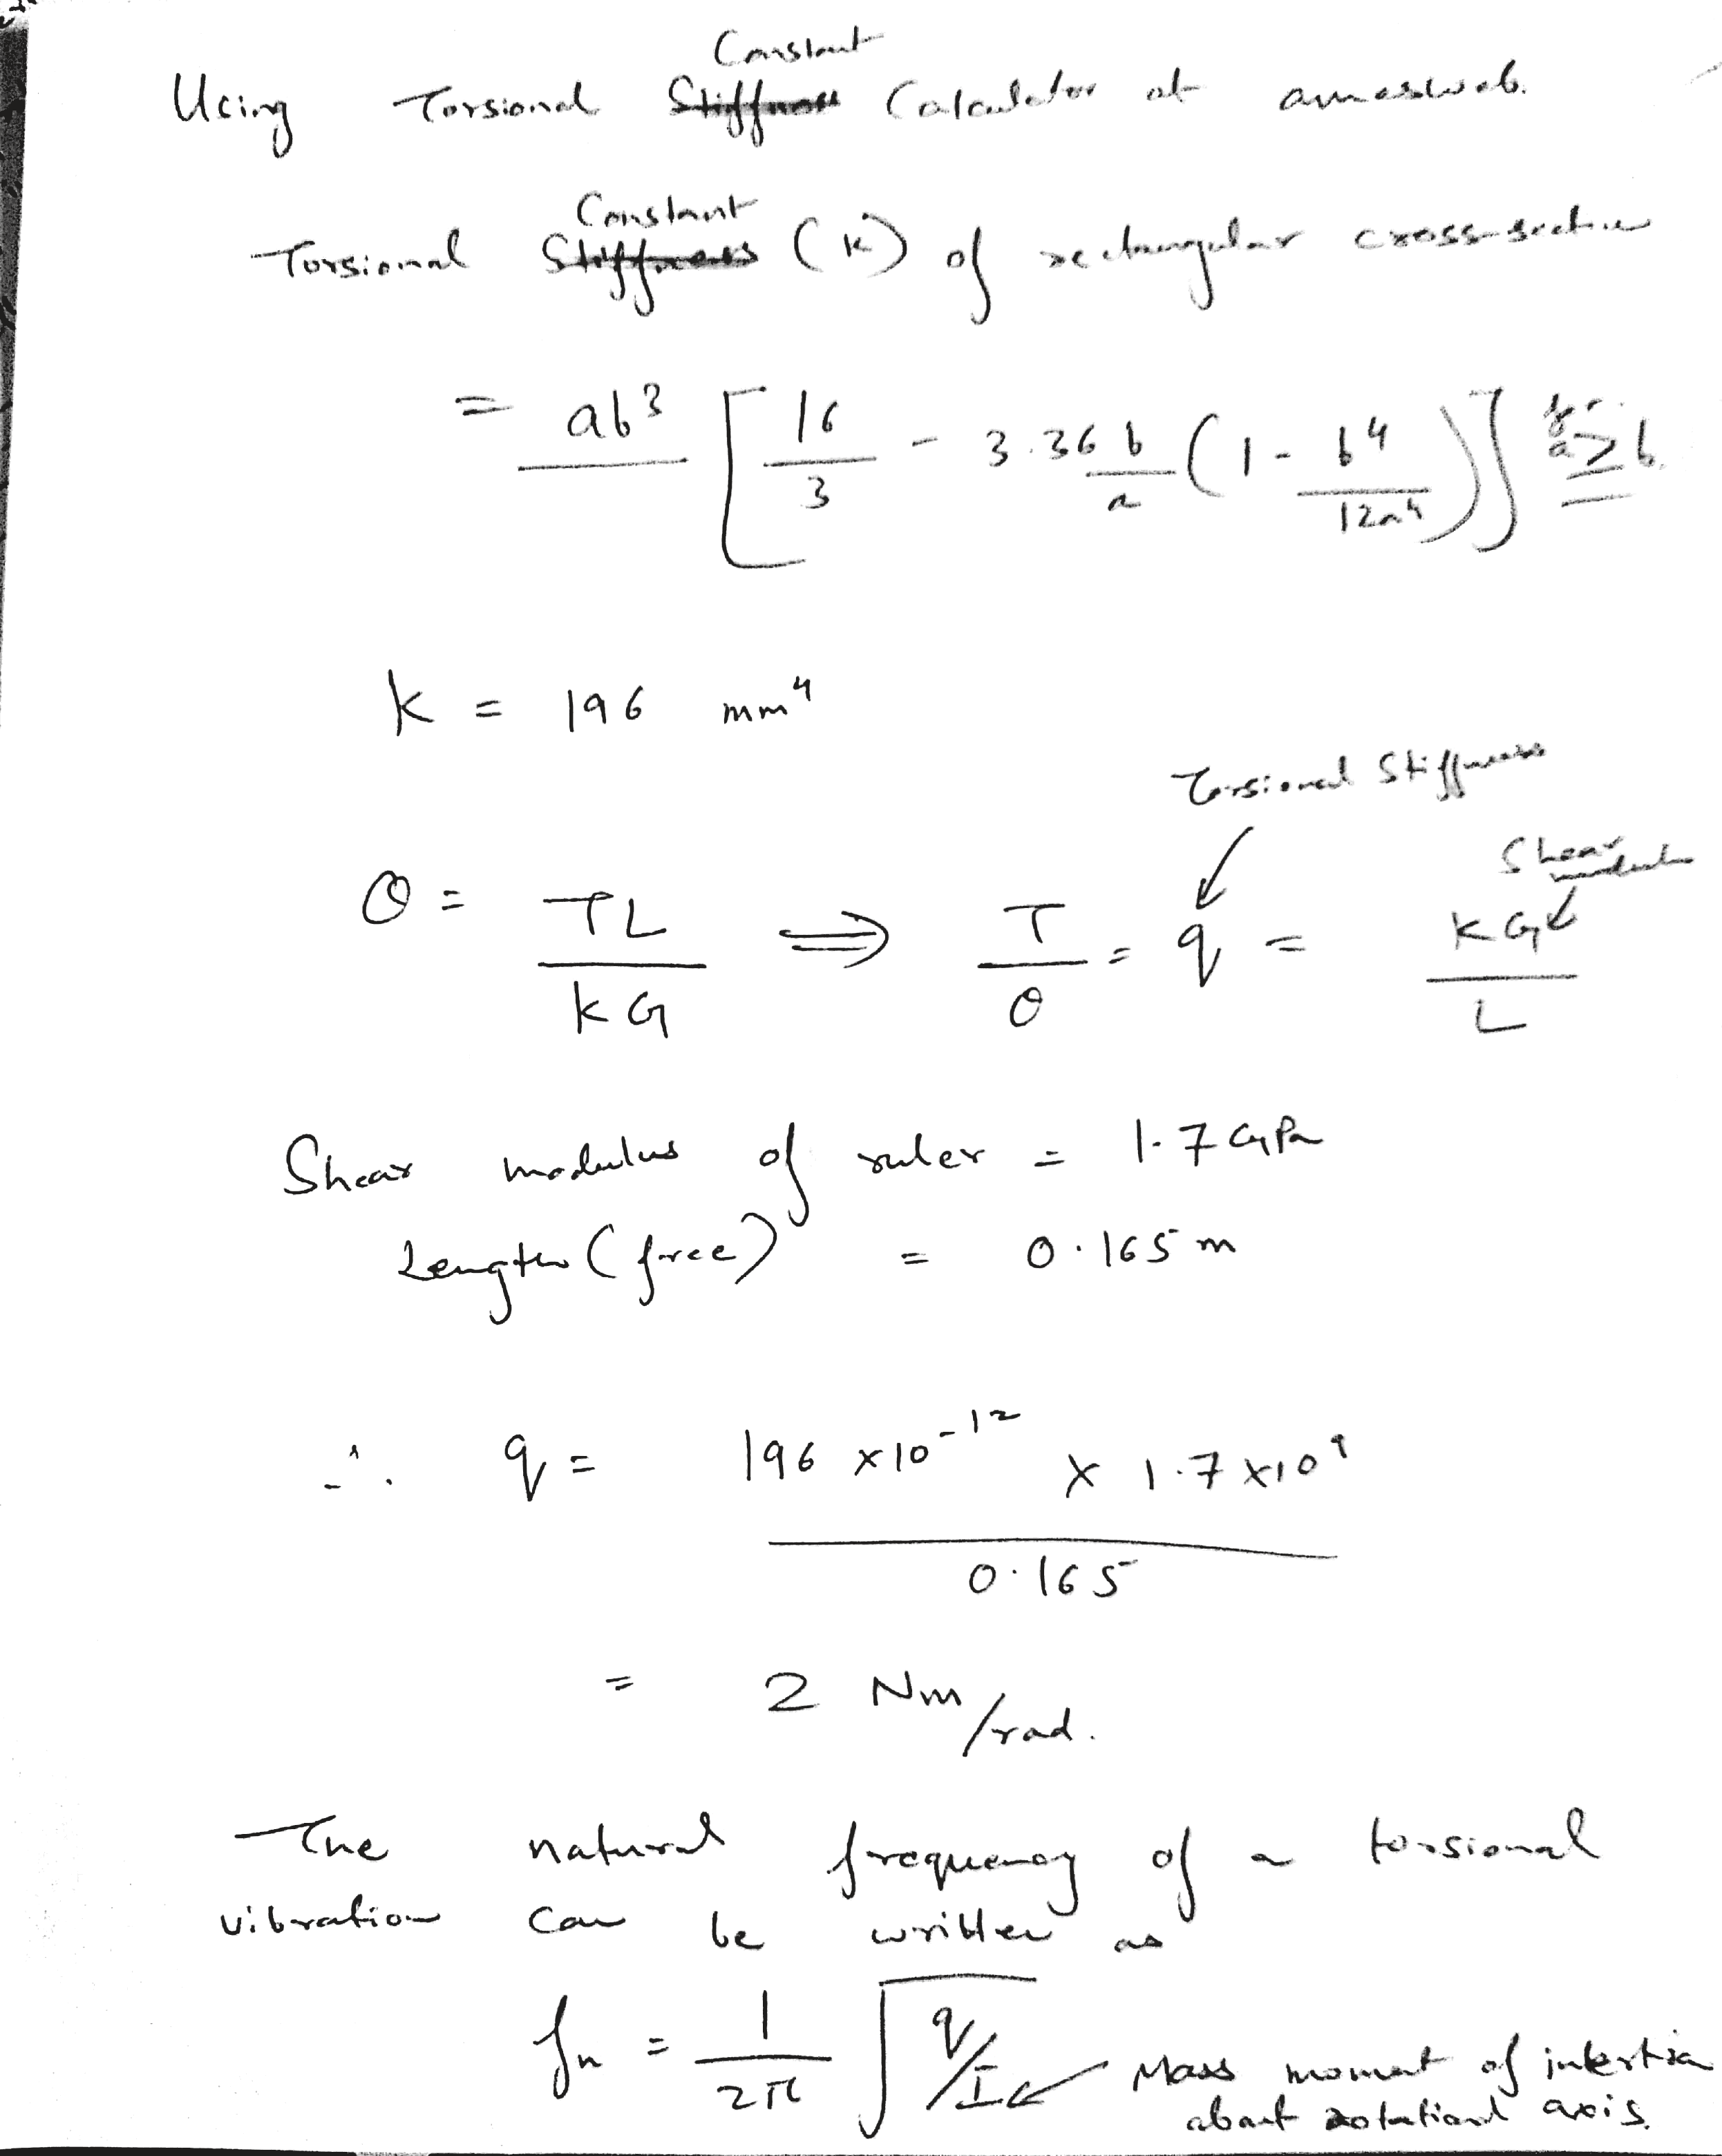
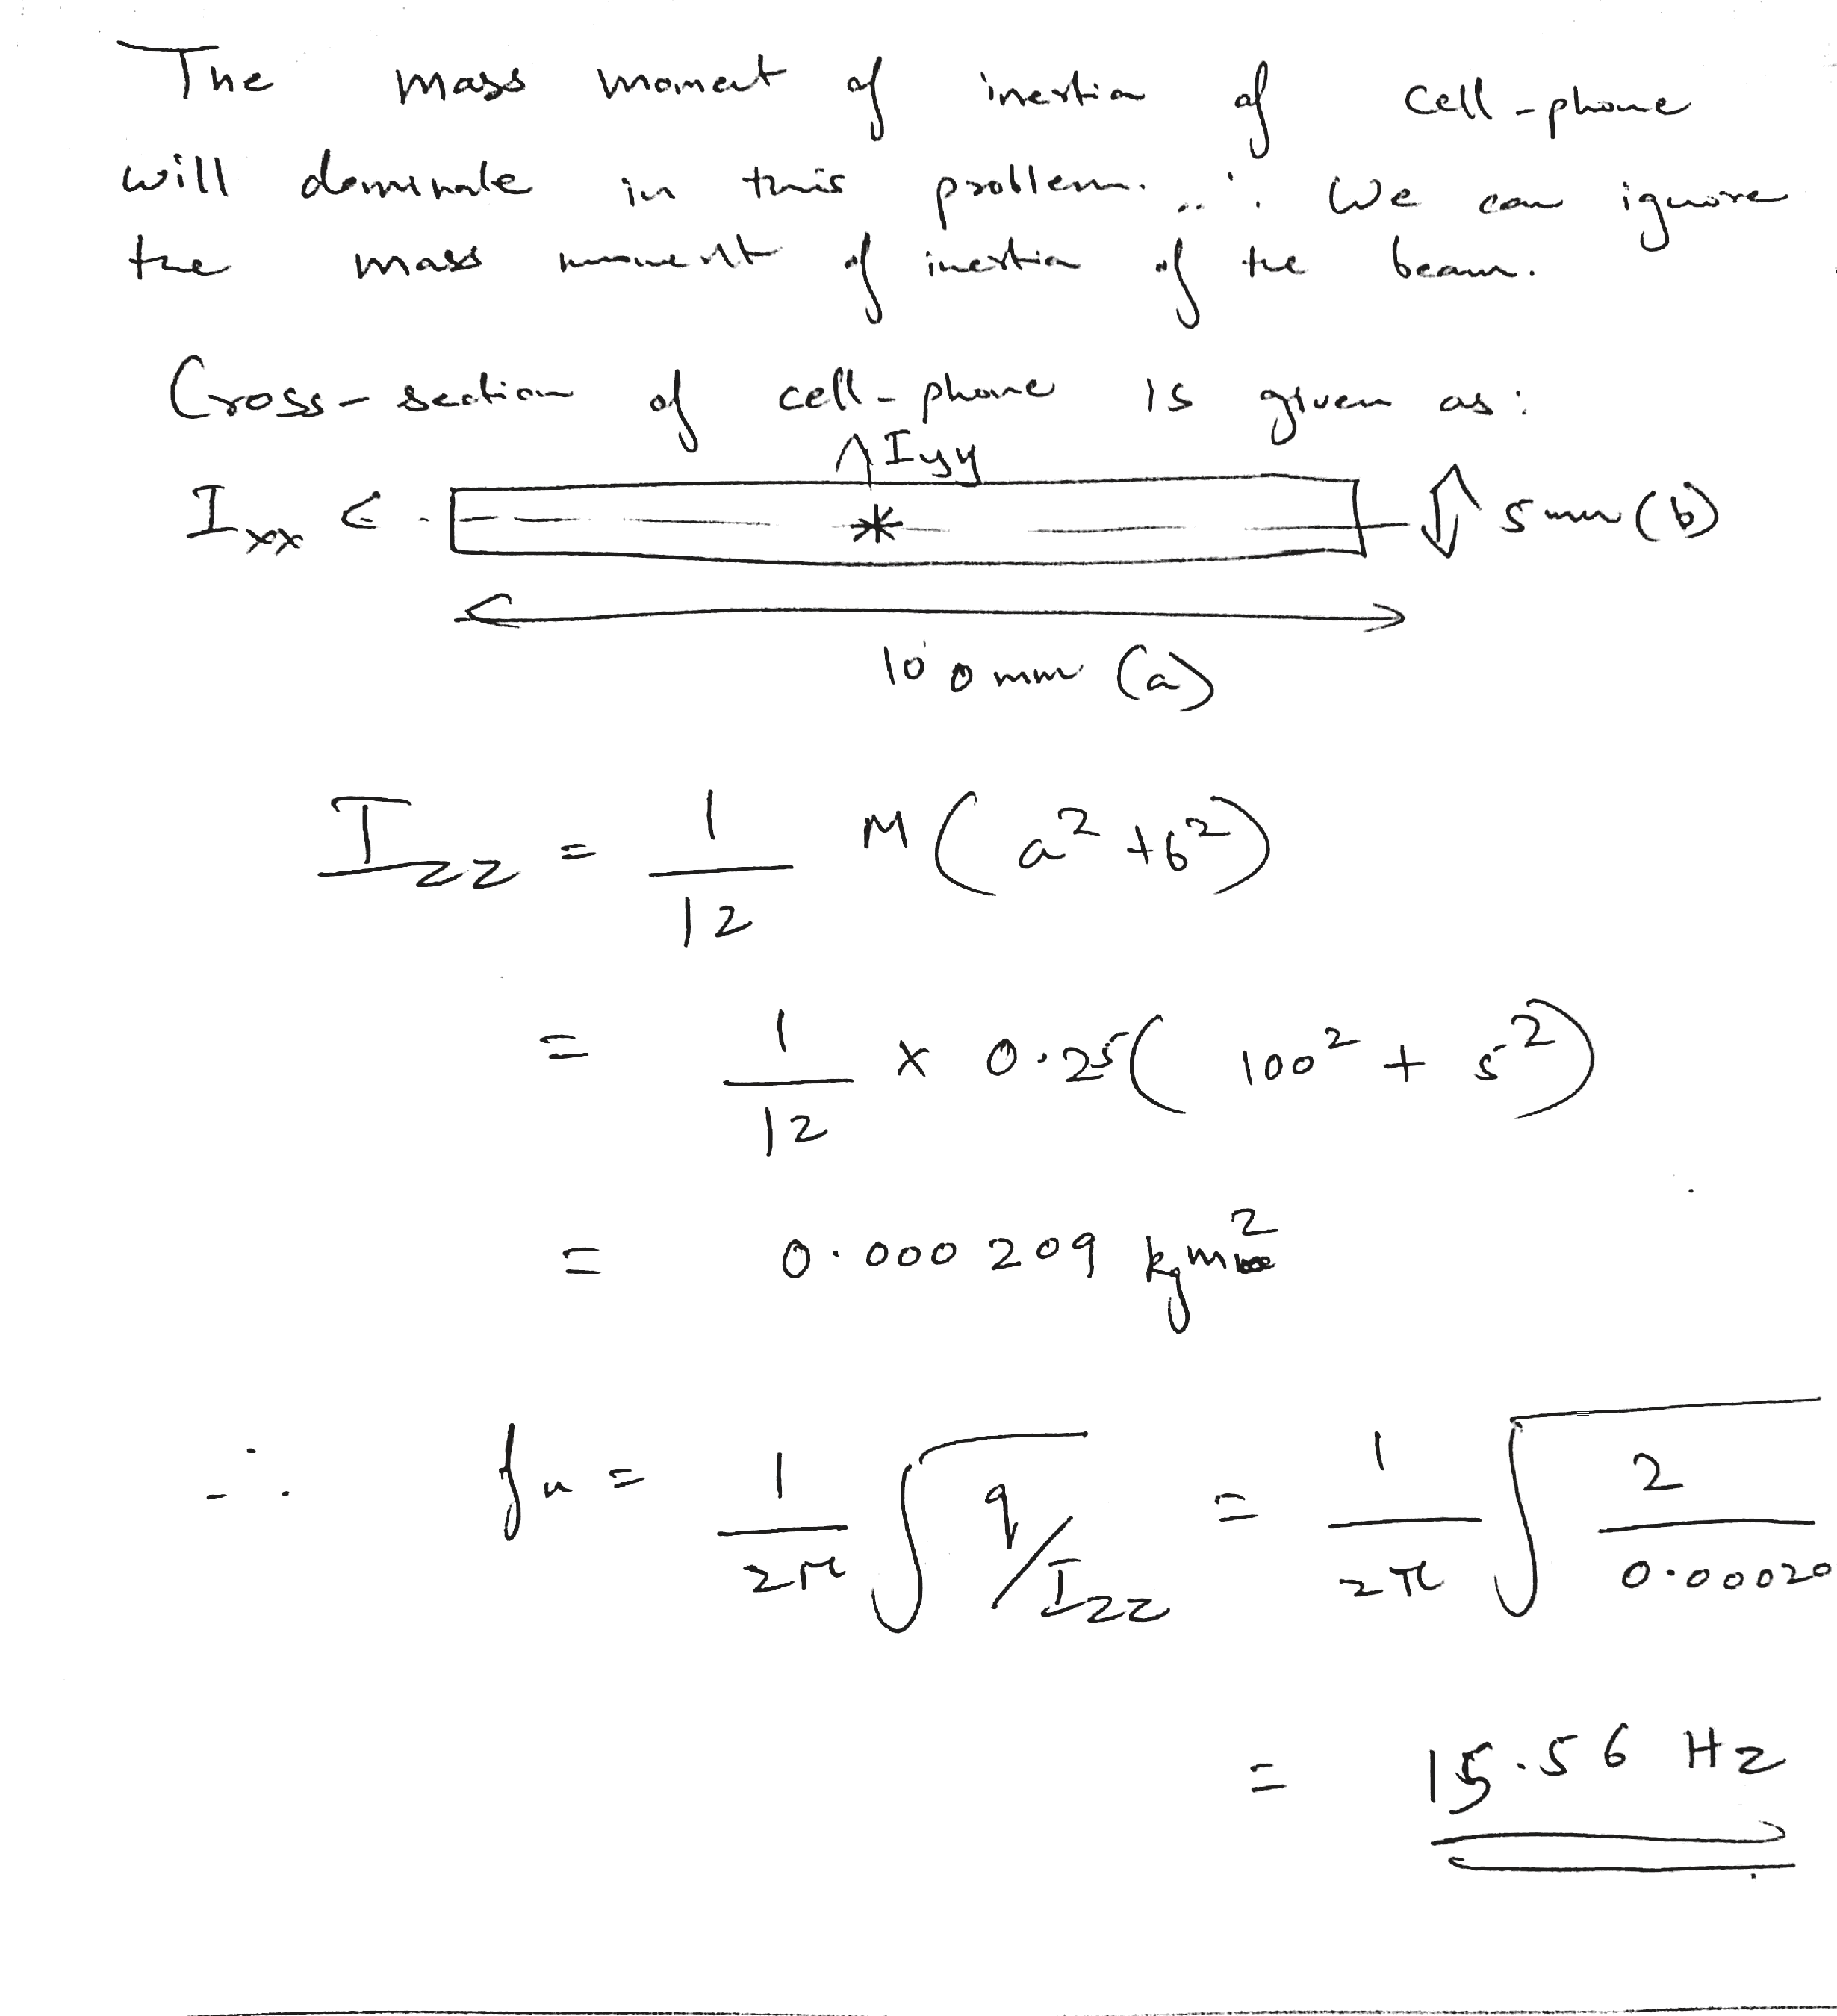
Second mode: torsional
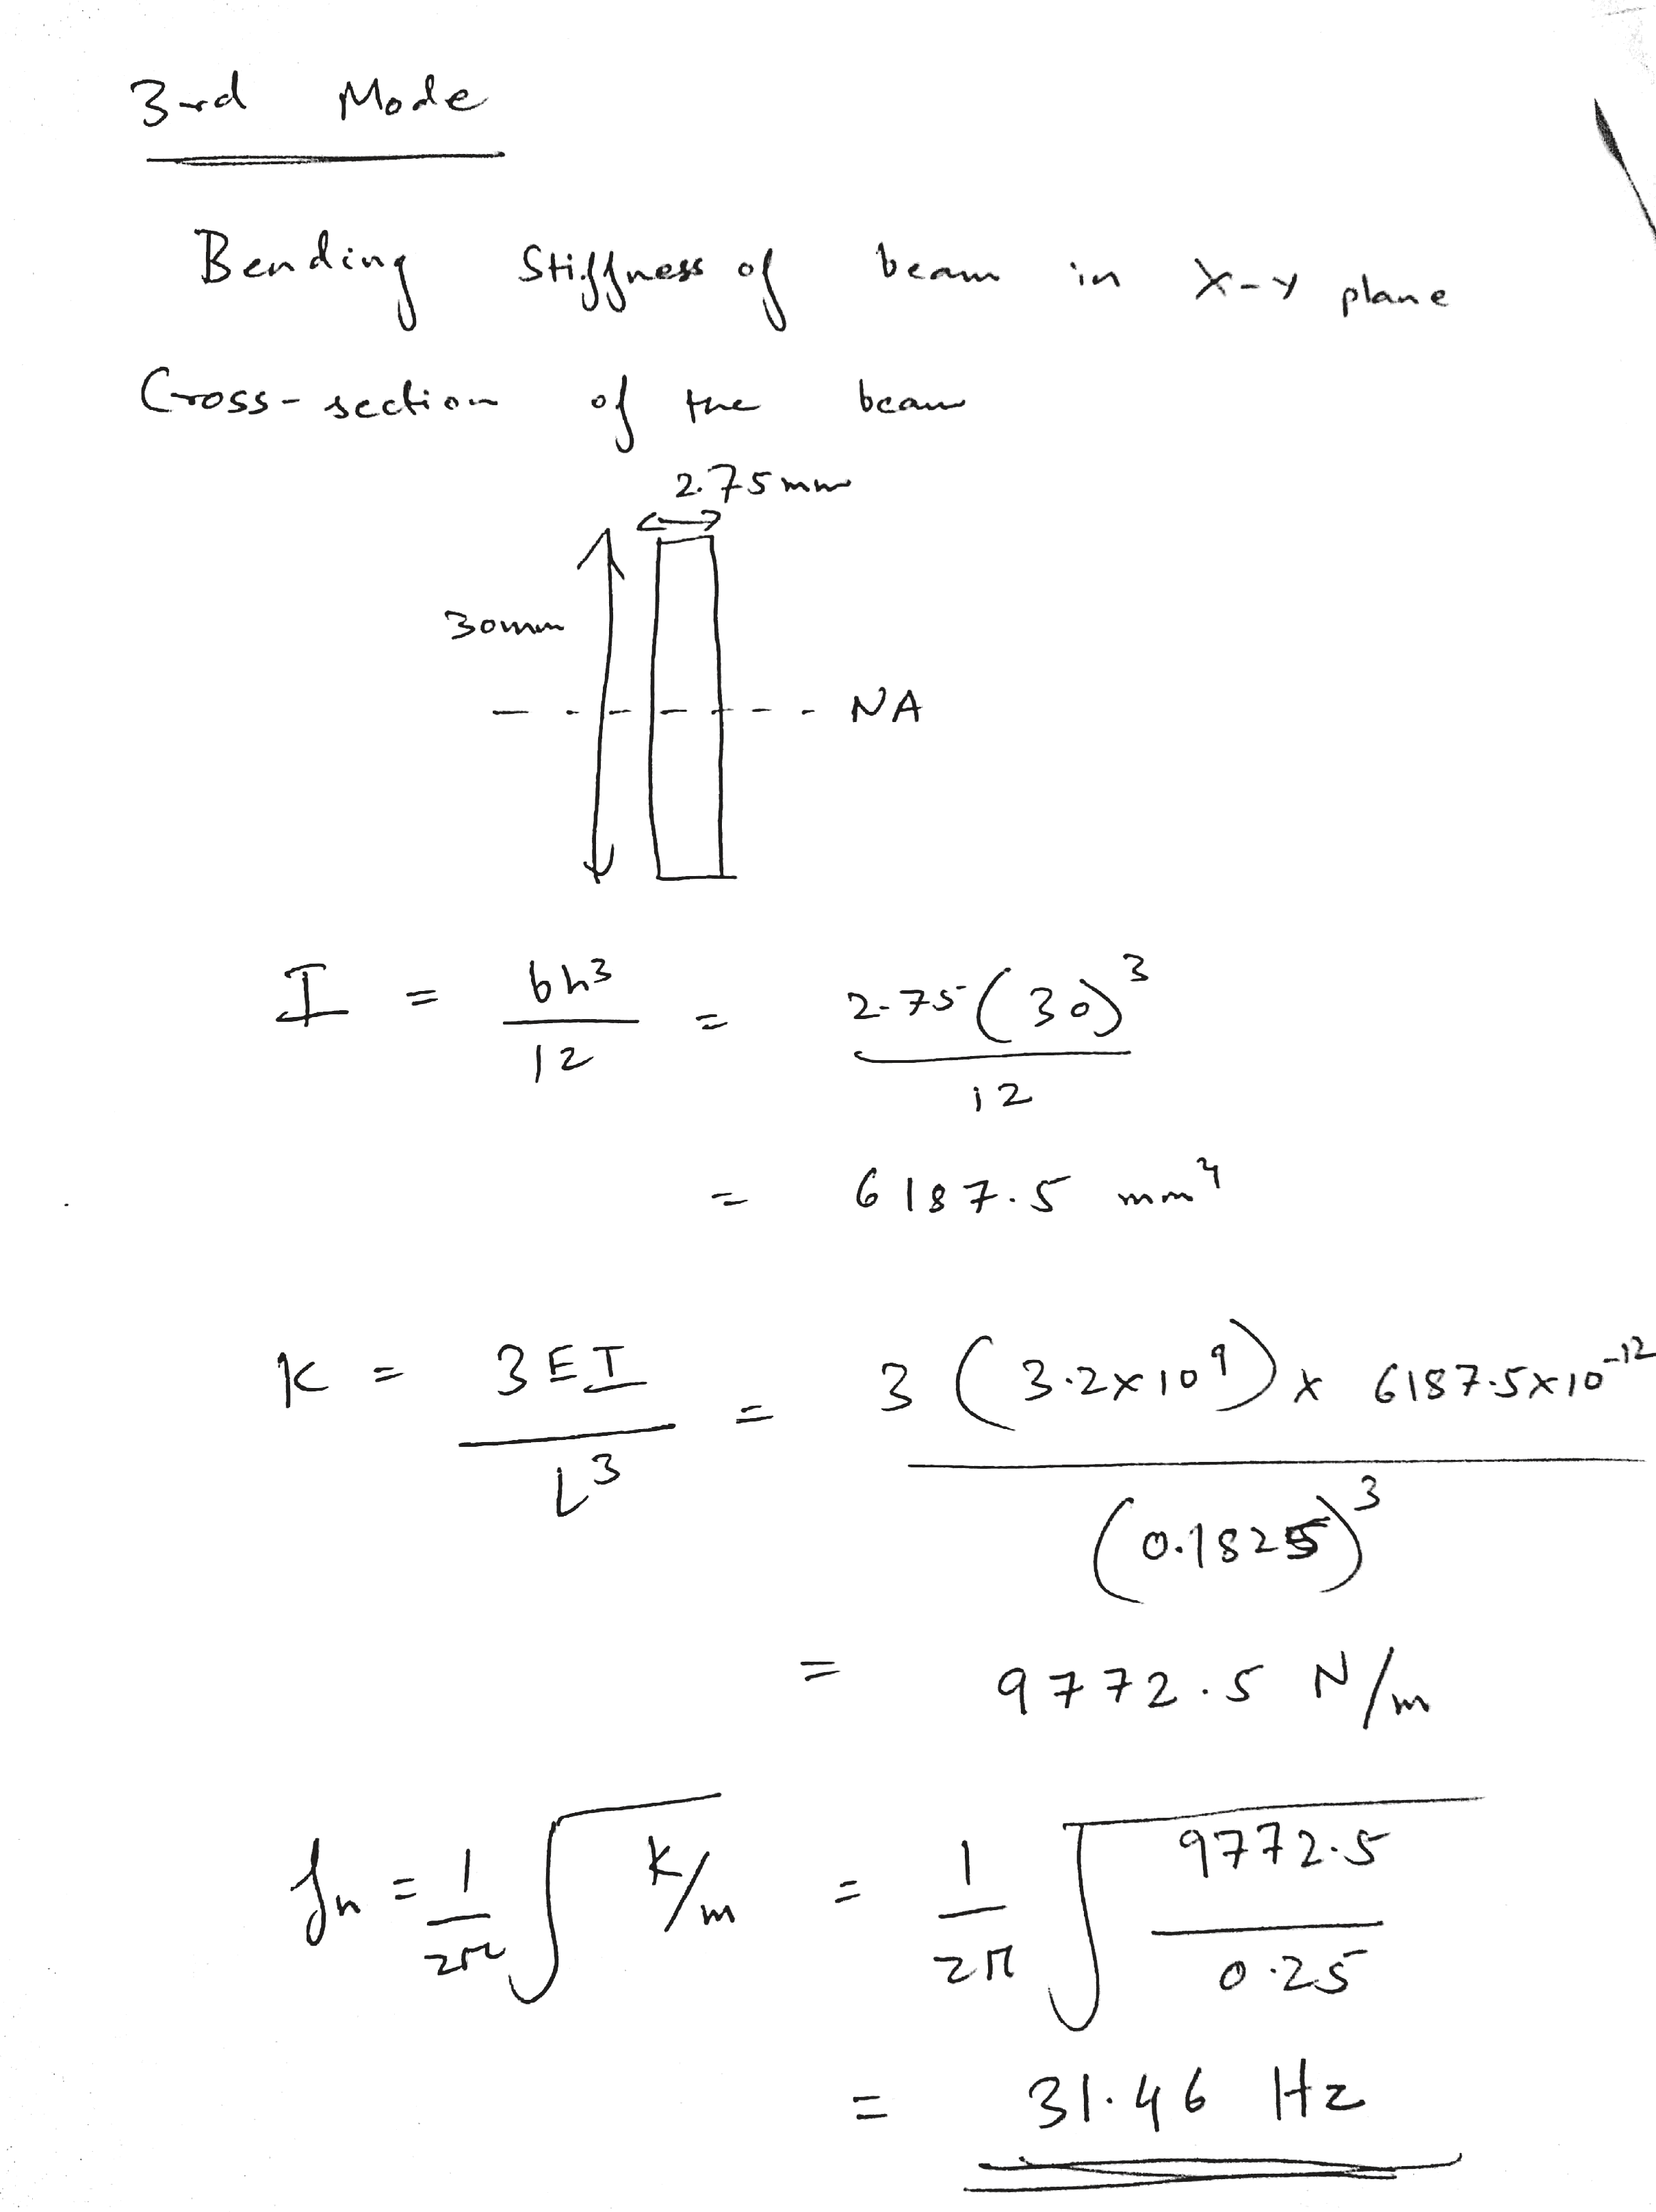
Third mode: bending in the X-Y plane
Comparison
| Mode | Dominant deformation | Experiment | FEA | Hand calc |
|---|---|---|---|---|
| First | Bending (Y-Z plane) | 3.1 Hz | 3.19 Hz | 3.22 Hz |
| Second | Torsion (about Y) | — | 14.6 Hz | 15.56 Hz |
| Third | Bending (X-Y plane) | — | 30.7 Hz | 31.46 Hz |
Although this is a simple problem, it was encouraging to see strong agreement between theoretical calculations, FEA, and experiment. It also helped build confidence in the FEA software package for modal analysis.